In the wall panel industry, there is a question every B2B buyer asks but rarely gets a straight answer to: Why does the same-looking panel from two different factories have such a wide price gap?
The difference is not always margin. Often, it is the hidden economics of manufacturing—raw material sourcing, extrusion line efficiency, energy costs, waste rates, and quality control infrastructure. Understanding these factors gives you negotiating power, protects you from pricing traps, and helps you identify which suppliers are built for the long haul.
At LeadFlow, we operate eight extrusion lines across a 12,000m² manufacturing campus. We are transparent about our cost structure because we know that educated buyers choose value, not just the lowest number.
This guide breaks down the manufacturing economics of WPC, SPC, and WET wall panels. For B2B buyers, it is a tool to evaluate supplier quotes, optimize your own margins, and understand exactly what you are paying for.
Part 1: Raw Materials—The 70% Cost Driver
Raw materials account for 65–75% of the total manufacturing cost of a wall panel. Small variations in ingredient selection create significant price differences.
1.1 Resin (PVC/PE)—The Single Largest Line Item
Resin prices fluctuate with global oil markets. But even at the same market price, suppliers have choices:
| Resin Type | Cost Index (Relative) | Performance Impact |
|---|---|---|
| Virgin PVC (SGS-5 or SGS-7) | 1.0x (baseline) | Consistent melt flow; predictable shrinkage; excellent mechanicals |
| Recycled PVC (post-industrial regrind) | 0.55–0.70x | Variable viscosity; darker color; potential contamination; shorter service life |
| Virgin PE (LLDPE or HDPE) | 1.15–1.25x | Higher UV resistance; flexible; used for exterior formulations |
| Mixed recycled plastic | 0.40–0.60x | Unpredictable blend; often color-stable only with dark solid finishes |
LeadFlow Practice: We use 100% virgin PVC for all interior-grade panels and virgin PE for our Tropi-WPC exterior line. We do not use post-industrial regrind in our primary formulation. If you request a recycled-content product for environmental certification, we formulate a separate line with controlled-regrind feedstock and label it accordingly.
What This Means for Your Quote: A supplier using 30% regrind can offer a WPC panel at $2–3/sqm less than a virgin-material factory. That panel may pass initial visual inspection but is more likely to warp, discolor, or crack over time.
1.2 Wood Fiber vs. Calcium Carbonate—The Filler Decision
Both WPC and SPC use fillers to reduce resin cost. But the type of filler changes everything:
| Filler Type | Cost per Ton | Density | Effect on Panel |
|---|---|---|---|
| Wood flour (120 mesh, kiln-dried) | $180–$250 | 0.4–0.6 g/cm³ | Lower weight; warm touch; requires coupling agents |
| Bamboo flour (similar) | $220–$300 | Similar | Slightly better dimensional stability than wood |
| Calcium carbonate (heavy) | $80–$120 | 2.6–2.8 g/cm³ | Higher density; rigid; zero moisture absorption (SPC) |
| Calcium carbonate (light/fine) | $120–$180 | 2.4–2.6 g/cm³ | Better dispersion; used in premium SPC |
Cost Trade-off:
WPC with higher wood flour content (50%+) is lighter but requires more resin to bind.
SPC with higher calcium carbonate content (70%) is cheaper per ton of raw material but creates heavier panels—increasing shipping cost.
LeadFlow Formula Optimization: We balance filler content against density to minimize shipping weight while maintaining performance. Our WPC wood flour loading is 45–50%—high enough for wood-like texture, low enough to keep the panel moldable and impact-resistant.
1.3 Additive Package—The Performance Differentiator
Additives are 3–8% of the formulation by weight but disproportionately affect performance and cost:
| Additive | Cost Impact | Consequence of Skipping |
|---|---|---|
| Coupling agent (MA-g-PE/PP) | +$0.15–0.30/sqm | Poor wood-plastic bond; water wicking; delamination |
| UV stabilizer (HALS + benzotriazole) | +$0.20–0.40/sqm | Fading, chalking, surface cracking in 6–12 months |
| Lubricant (stearates, waxes) | +$0.05/sqm | Rough surface; extrusion instability; thickness variation |
| Antimicrobial (zinc pyrithione, silver ion) | +$0.25–0.50/sqm | Fungal growth in humid environments |
| Flame retardant (aluminum hydroxide, magnesium hydroxide) | +$0.30–0.80/sqm | Failure to meet B1 fire rating—project rejection |
| Pigment/masterbatch | +$0.10–0.30/sqm | Color inconsistency from batch to batch |
LeadFlow Standard: We add all required performance additives at full dosage. No sub-dosing. We can supply a formulation sheet for each batch showing actual ingredient percentages.
Part 2: Manufacturing Efficiency—The Line Cost
Raw materials come into the factory. What comes out depends on the equipment and operational discipline. Here is what drives conversion cost:
2.1 Extrusion Line Technology
| Line Type | Output (kg/hr) | Energy Consumption | Labor Requirement | Typical Investment |
|---|---|---|---|---|
| Single-screw extruder (old generation) | 150–250 | High | 3–4 operators per line | $150k–$250k |
| Twin-screw conical extruder (standard) | 300–500 | Moderate | 2 operators per line | $350k–$600k |
| Parallel twin-screw with degassing (modern) | 500–800 | Lower per kg | 1–2 operators per line | $800k–$1.5M |
| Fully automated line with gravimetric dosing | 800–1,200 | Lowest per kg | 1 operator for 2–3 lines | $1.2M–$2.5M |
Economic Impact: A modern high-output line reduces conversion cost by 25–40% compared to older single-screw systems. Factories that have invested in new lines can offer better pricing while maintaining higher quality—or offer the same pricing with significantly better margins.
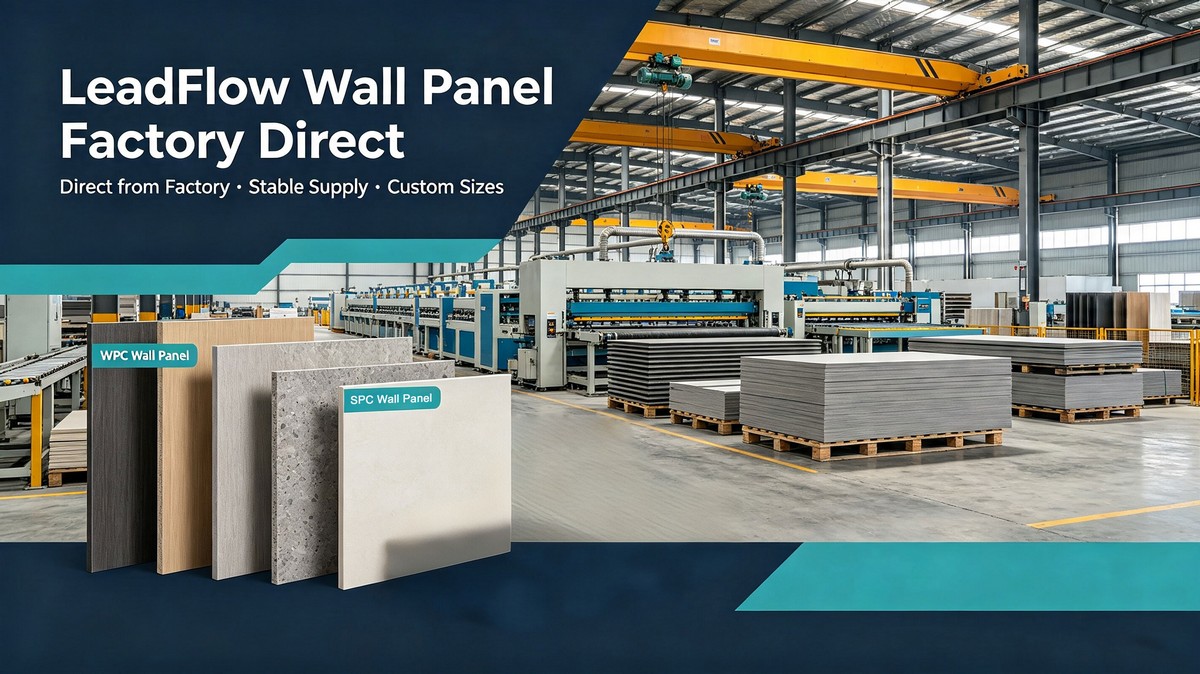
LeadFlow Equipment: We operate 8 parallel twin-screw lines with gravimetric dosing and downstream cooling calibration. Total annual capacity: 15,000+ tons.
2.2 Waste and Scrap Rate
Every extrusion line produces startup scrap, transition waste, and rejected panels. The waste rate directly affects material cost:
| Factory Type | Typical Waste Rate | Effect on Unit Cost |
|---|---|---|
| Poorly managed / manual lines | 8–12% | Adds 8–12% to raw material cost per sellable panel |
| Industry average (managed) | 4–6% | Adds 4–6% |
| LeadFlow target (controlled) | <2.5% | Minimal cost impact; waste recycled in-house |
LeadFlow Practice: We regrind all clean production waste (startup, edge trim, off-spec panels) and reintroduce it at a controlled ratio (≤10%) into non-critical products. Our waste reduction is achieved through:
In-line thickness monitoring and automatic die adjustment
Preventive maintenance schedules on all screws and dies
Operator training certification program
2.3 Energy Cost—The Hidden Variable
Extrusion is energy-intensive. A typical 500kg/hr line draws 200–300kW of power. In regions with expensive electricity, energy can be 5–8% of total manufacturing cost.
Energy Efficiency Measures:
| Practice | Energy Savings | LeadFlow Status |
|---|---|---|
| Barrel heating with infrared/ceramic bands | 10–15% | Installed on all lines |
| Variable frequency drives on pullers and cutters | 15–20% | Installed on all lines |
| Heat recovery for drying wood flour | 8–12% | Installed on drying system |
| Off-peak production scheduling | 15–25% on energy cost | Active |
Part 3: Quality Control—The Margin Protector
A factory that skips QC reduces cost today and increases returns, claims, and lost customers tomorrow.
3.1 Inspection Cost Breakdown
| QC Check | Frequency | Cost per Batch | Consequence of Skipping |
|---|---|---|---|
| Incoming raw material testing | Every lot | $50–$100 | Contaminated resin or incorrectly sized filler causes production defects |
| In-line thickness and width | Continuous (automated) | Included in line cost | Panels outside tolerance—rejected on site |
| Visual inspection (face, edge, ends) | Every panel (manual) | 2–3 inspectors per shift | Surface defects shipped to customer |
| Physical testing (density, water absorption) | Per shift | $30–$60 per test | Unreported formulation drift |
| Colorimetry (ΔE measurement) | Per batch | $20 per measurement | Color mismatch between shipments |
| Final packing inspection | Per container | 1 inspector for 2 hours | Damaged panels arrive; claims filed |
Total QC Cost (as % of revenue): 1.5–3.0% for a well-run factory. <0.5% indicates corners are being cut.
LeadFlow Investment: Our QC department has 8 full-time inspectors and technicians. We spend approximately 2.2% of revenue on quality assurance—above the industry average, but it keeps our return rate below 0.5%.
Part 4: Economies of Scale—The Volume Advantage
Manufacturing is a volume game. Fixed costs (machinery, rent, management, overhead) are spread over total production output.
| Annual Production (tons) | Fixed Cost per Ton | Raw Material Discount | Total Cost per Panel (Relative) |
|---|---|---|---|
| < 1,000 tons (small factory) | High | Limited (spot market) | 1.15x–1.25x |
| 1,000–5,000 tons (mid-size) | Moderate | 3–5% discount | 1.0x (baseline) |
| 5,000–15,000 tons (large) | Low | 8–12% discount | 0.85x–0.92x |
| > 15,000 tons (major) | Lowest | 12–18% discount + logistics efficiencies | 0.78x–0.85x |
LeadFlow Scale: Our 15,000+ ton annual capacity gives us bulk purchasing power for PVC resin, wood flour, and additives. We pass a portion of this advantage to our distributors through volume-based tier pricing.
Part 5: Understanding Supplier Pricing—A Line-by-Line Breakdown
Here is how a transparent factory calculates the FOB price per square meter for a standard WPC panel (6mm x 300mm x 2900mm, wood finish):
| Cost Component | Calculation | Cost per sqm (USD) |
|---|---|---|
| Raw materials (PVC + wood flour + additives) | $1,200/ton ÷ 45 sqm/ton | $26.67 |
| Additive package (UV, coupling agent, color) | Included in above | — |
| Manufacturing (conversion: labor + energy + overhead) | $350/ton ÷ 45 sqm/ton | $7.78 |
| Quality control and testing | 2.2% of direct cost | $0.77 |
| Packaging (foam interleaf, shrink wrap, corner protectors) | Per sqm | $0.85 |
| Inland logistics to port (trucking) | Per container allocated | $0.45 |
| Total Manufacturing Cost | — | $36.52 |
| Factory Margin (15–25%) | — | $5.48–$9.13 |
| FOB Price per sqm | — | $42.00–$45.65 |
Price Benchmark (Industry Reference, 2026):
Low-end WPC (recycled content, no UV): $28–$32/sqm
Mid-range WPC (virgin resin, standard UV): $38–$45/sqm
Premium WPC (virgin PE-WPC with ASA cap): $55–$70/sqm
SPC (standard, 4–6mm): $25–$35/sqm (note: lighter raw material cost but heavier shipping)
WET premium panels: $65–$90/sqm
What "Too Cheap" Looks Like: If a supplier quotes $28/sqm for a panel that appears to be virgin-grade WPC, they are either:
Using recycled/reground resin
Sub-dosing or skipping additives
Operating at a loss to gain market share (unsustainable)
Misrepresenting the product specification
Part 6: Shipping Economics—The Non-Manufacturing Cost That Matters
While not part of manufacturing, shipping cost is integral to your landed cost. Here is how panel density affects freight:
| Product | Density (g/cm³) | Sheets per 40ft HC (6mm thickness) | Freight Cost per sqm (to US West Coast, est.) |
|---|---|---|---|
| WPC | 1.0–1.2 | 1,900–2,200 | $2.50–$3.00 |
| SPC | 1.5–2.1 | 1,200–1,500 | $3.80–$4.80 |
| WET (mid-weight) | 1.3–1.6 | 1,500–1,800 | $3.20–$4.00 |
Strategic Insight: WPC's lower density means 30–45% more coverage per container than SPC. For large-volume projects, this freight efficiency often offsets WPC's slightly higher raw material cost.
LeadFlow Service: We provide a container load plan with every quotation—showing exactly how many sheets fit, packed weight, and recommended load configuration. We also assist with LCL consolidation for smaller orders.
Part 7: The "Hidden" Factory Costs That Signal Quality
When evaluating a supplier, look for evidence that they absorb these costs—because they signal long-term commitment:
| Cost | Why It Matters | LeadFlow Practice |
|---|---|---|
| R&D formulation testing | Product improvement and regulatory compliance | Dedicated 5-person R&D team; annual budget 3% of revenue |
| Tooling maintenance (dies, screws) | Consistent dimensions and surface quality | Scheduled replacement every 18 months |
| Worker training and certification | Reduced human error on the line | Monthly training programs; skill-based pay |
| ISO/quality system maintenance | Process discipline and traceability | ISO 9001:2015 certified; external audits annually |
| Product liability insurance | Protects both factory and buyer | $5M policy covering international markets |
| Finished goods inventory buffer | Quick ship for urgent orders | 20,000+ sqm stock on hand |
A factory that maintains these systems will charge more—and deliver more. A factory that does not will offer a lower price and a higher risk profile.
Part 8: How LeadFlow Shares the Economics with You
Our pricing model is transparent. When you request a quotation from us, we can break it down as follows:
Ex-factory price (clearly stated as FOB port)
Recommended container load (sheets per size, total weight, CBM)
Sample order cost (if applicable, including courier shipping)
Volume discount tiers (3%, 5%, 8% at defined annual order thresholds)
Lead time by product type (standard vs. custom finish)
Inspection protocol (options for in-house, video, or third-party)
We do not hide markups in "packaging fees" or "documentation charges." Every line item is explained in plain terms.
The Buyer's Checklist: Assessing Supplier Economics
Before signing your next purchase order, ask your supplier these questions. Their answers will reveal whether you are dealing with a transparent manufacturer or a trader with opaque cost structures:
What percentage of your resin is virgin vs. recycled?
Do you have a UV stabilizer in your formulation? What type and dosage?
What is your typical extrusion waste rate? How is waste handled?
How many extrusion lines do you operate? What is their age and type?
Do you have in-house color matching and finishing?
Can you share a batch-specific formulation sheet?
What is your typical container loading density for this SKU?
Do you hold stock for urgent orders, or is every order made to order?
LeadFlow's Promise: We answer every one of these questions in writing, with supporting documentation available upon request. No vague responses. No "that is proprietary" excuses.
Conclusion: Price Is What You Pay, Value Is What You Get
Understanding manufacturing economics allows you to distinguish between a supplier offering genuine efficiency and one offering compromised quality at a discount.
At LeadFlow, our prices are competitive because our scale gives us purchasing power and our efficiency keeps conversion costs low—not because we cut corners on materials, additives, or quality control.
When you buy from a factory that understands cost engineering, you get consistency, longevity, and peace of mind. And peace of mind does not show up on a balance sheet—but it shows up in your repeat orders.
Request a Detailed Quote
Our export team can provide:
FOB pricing for your preferred thickness and finish
Container load plan with shipping weight and CBM calculation
Formulation summary (ingredients, not exact percentages)
Production timeline from deposit to delivery
Reference list of long-term distributors in your region
Contact us today. We will show you the numbers behind the panel.
LeadFlow—Where manufacturing transparency meets commercial reliability.